If your app has never experienced memory issues, is it really in production?
An Erlang-Inspired Node.js project I deployed at work runs out of memory randomly. It maintains a relatively flat memory usage profile at about 10% of the server’s RAM, but it will suddenly spike to 1.5x ~ 2x RAM.
Thankfully Heroku is flexible enough to tolerate spikes under 2x of the allotted RAM so in most cases the app continues to do its job and the worst that happens is I get notified about it. Despite its ability to elegantly recover from crashes, my pride felt like it was being curb-stomped whenever Slack notified me the server ran out of memory again.

After determining to redeem my self-respect by fixing the issue, I quickly realized I had no idea where to begin!
The Crime Scene
Here’s what the application structure looked like.
// object == process supervisor
// attribute == node.js process

var app_structure = {

  http: 'express.js',
  connection_lock: 'semaphores',

  dam: {
    pusher: 'rabbitmq consumer',
    queuer: 'rabbitmq producer',
    retrier: 'rabbitmq consumer'
  }
}
Since the app was really seven different node processes (five programs, two supervisors) cooperating together, there were seven times as many processes to analyze than the average node app has.
The more processes we spun up bruh
The more problems we seen– Biggie “Mo Problems” Remix
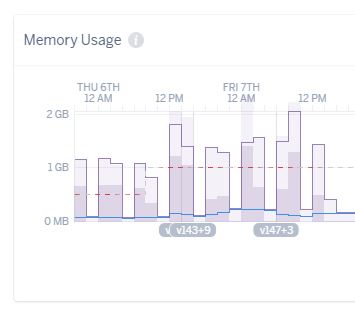
What do you do when you have too many processes to analyze? Create a new one, duh.
The new process was responsible for receiving data on the memory usage of every other process and send it off to some other server for analysis.
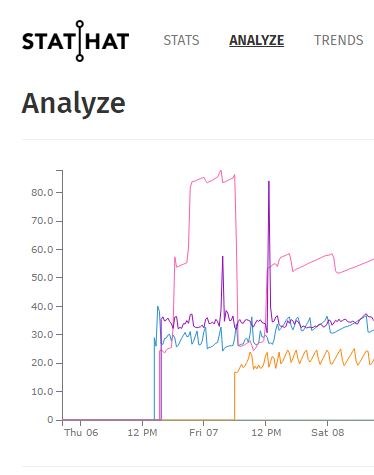
It became obvious the queuer process (pink) wasn’t releasing memory like it should. Weird, because it was the simplest process. It made two connections to a RabbitMQ server and put things it received on queues. Less than thirty lines of code. One entry-point, and the libraries being used were being used in the pusher (purple). Where could the memory leak be hiding??
Wish I had an exciting story to tell you about my elite debugging skills and an obscure memory analysis tool / technique I employed, but this is not that sort of blog post.
It occurred to me the key difference is pusher was designed to shut down after a brief period of inactivity, and that’s when inspiration hit harder than a hi-five from God.
If the process shuts down frequently, I won’t be affected by the memory leak.

Within minutes the queuer was wired up to shut down after a few seconds of idleness. The only thing that was left to do was sit back and watch the graphs plot the data.
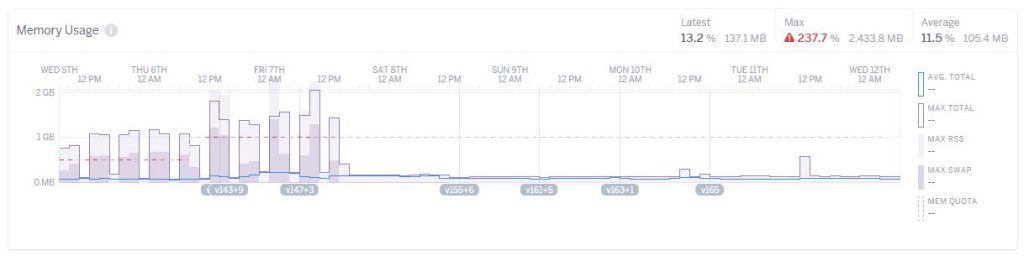
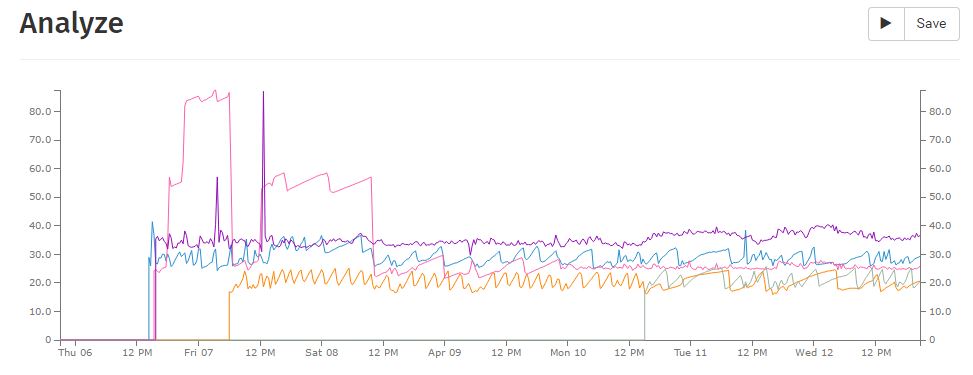
Look at that. Practically flat memory usage.
It was trivial to implement this solution because the application was broken up into distinct components that could run without each other, so it took no special effort to force a component to shut down frequently without affecting the overall app.
Score one for the Erlang-Inspired Node.js app architecture!